
Page 152 - Balance Hídrico de Bolivia
P. 152
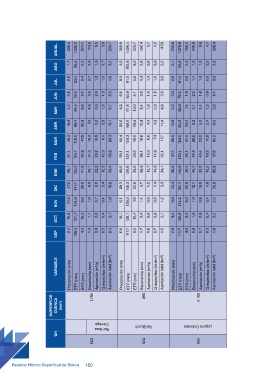
ANUAL  336,0  1 .336,2  224,1  113,5  6,5  3,6  203,7  356,8  1 .406,4  225,7  132,4  3,7  4,2  117 ,9  333,6  1 .378,8  188,2  146,8  9,8  4,7  308,9


                          AGO   1,7  96,5  2,2  2,0  1,3  0,7  3,5  4,0  105,6  6,0  2,5  0,8  0,9  2,2  2,1  96,6  2,4  1,3  1,0  0,5  2,6


                          JUL   2,5  83,2  2,4  2,7  1,8  1,0  4,8  8,9  91,0  5,8  4,3  1,4  1,6  3,8  2,8  81,0  2,6  1,7  1,3  0,6  3,6


                          JUN   2,6  76,0  2,2  3,5  2,4  1,3  6,3  6,6  83,8  5,1  3,9  1,4  1,5  3,5  2,0  76,0  1,9  2,2  1,8  0,9  4,7


                          MAY   4,2  84,5  8,6  4,8  3,3  1,8  8,7  8,2  91,8  13,0  5,4  1,8  2,0  4,8  2,3  82,9  7 ,4  3,1  2,4  1,2  6,5


                          ABR   18,8  99,4  32,8  7 ,3  5,0  2,8  13,1  24,0  106,6  28,8  12,8  4,4  4,9  11,4  14,8  104,8  23,5  6,2  5,0  2,4  13,0


                          MAR   48,3  118,0  47 ,9  16,3  10,9  6,1  29,3  55,4  124,3  48,0  19,8  6,6  7 ,4  17 ,7  56,5  124,0  41,5  29,6  23,2  11,0  62,2


                          FEB   91,4  119,7  32,9  31,3  23,2  12,9  56,2  93,1  122,1  29,2  36,1  13,3  14,9  32,1  97 ,7  123,4  26,1  46,4  40,4  19,2  97 ,6


                          ENE   96,1  135,3  41,3  33,1  22,2  12,3  59,4  98,6  139,8  39,0  38,3  12,7  14,3  34,1  90,0  146,3  38,3  40,7  32,0  15,2  85,8


                          DIC   47 ,0  147 ,7  30,0  9,0  6,0  3,4  16,2  29,3  146,3  22,6  3,7  1,2  1,4  3,3  43,4  151,1  22,8  12,7  10,0  4,8  26,8


                          NOV   10,3  134,9  9,6  1,0  0,7  0,4  1,8  6,1  139,3  7 ,6  1,4  0,5  0,5  1,2  9,8  144,2  9,0  1,0  0,8  0,4  2,2


                          OCT   10,8  131,7  10,0  1,1  0,8  0,4  2,1  16,1  138,1  12,4  2,4  0,8  0,9  2,1  9,4  136,8  8,0  1,0  0,8  0,4  2,2


                          SEP   2,4  109,3  4,3  1,3  0,9  0,5  2,4  6,6  117 ,7  8,2  1,7  0,6  0,7  1,5  2,9  111,7  4,8  0,8  0,7  0,3  1,8


                          VARIABLE  Precipitación (mm)  ETP (mm)  ETR (mm)  Escorrentía (mm)  Aportación (m 3 /s)  Q específico (l/s-km 2 )  Aportación total (hm 3 )  Precipitación (mm)  ETP (mm)  ETR (mm)  Escorrentía (mm)  Aportación (m 3 /s)  Q específico (l/s-km 2 )  Aportación total (hm 3 )  Precipitación (mm)  ETP (mm)  ETR (mm)  Escorrentía (mm)  Aportación (m 3 /s)  Q específico (l/s-km 2 )  Aportación total (hm 3 )


                        SUPERFICIE   CUENCA   (km 2 )  1 .795    890                      2.105


                          UH                     Cienaga  Río Yana   Río Busch                 Laguna Colorada
                                          023                    024                      025


      Balance Hídrico Superficial de Bolivia   150