
Page 128 - Estudios Economicos
P. 128
I
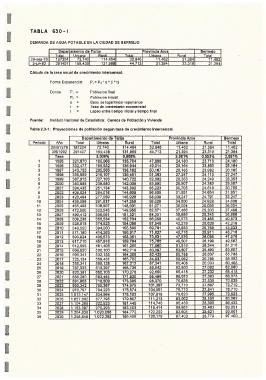
TABLA 630-I
I
DEMANDA DE AGUA POTABLE EN LA CIUDAD DE BERMEJO
DeDartamonto de Tariia I Provincia Arco I Bormeio
I -2§=5JD--761 1872041 72.740 Rl iral I Tntal I Urhana F3Liral I Tntal I
Tnlal
I Jrtlana
114.4641 32.846
11.462
21.3841 11.462
3-jurr.92 I 291407 159,438 131.9691 44.713 21,394 23 319| 21394
I Calculo do la tasa anual do crocimionto intorc8nsal.
Forma Exponencial: Px= Po I e ^ (i * I)
I Poblacion final
Poblacion inlcial
Base de logaritmos neperianos
Ta§a de crecimiento exponencial
Lapso entre tlempo inlclal y tiempo final
:,i
Fu®nto: lnstituto Nacional de Estadlstica: Cen§os de poblaci6n y vivienda
I Tabla 2.3-1: Proyoccjonos do poblaci6n segun tasa d® crocimfanto lntorconsal.
DODartamonto do Tan.ia Provincia Arc® Bormojo
Total
Total
Total
Rural
I I Periodo 29/9/1976 1 S7204 Urbana 114,464 32,846 Urbana 21,384 11,462
Rural
Aflo
72,740
11,462
3/6/1992
21,394
21,394
23,319
Tasa 291407 159,438 131,969 44,713 3.981% 0.553% 3.981%
0.908%
5.006% ,
I 12345878910111213141516171819202122.2324252627282930313233343536 1995 321,670 185.966 135,704 47,898 24,180 23,719 24,180
25,164
49,014
25,164
332.477
195,532
23,850
1996
136,944
205,563
23.982
343,755
138.192
26.185
26,185
1997
50.167
1998 355.559 216,107 139,451 51,363 2:I .2;4J 24,115 27,247
28,353
367,915
24.249
52,602
227,193
28.353
140.722
1999
I 2000 380.888 238,8ao 142,008 53,890 29,507 24,383 29,507
30,705
143.302
55.223
2001
24,518
30,705
394.435
251,134
2002 408,624 264,016 144.608 56,605 31.951 24,654 31,961
2003 423,484 277.559 145,928 58,038 33,247 24',791 33,247
2004 439.096 291`837 147.259 59,529 34.600 24,928 34,600
2005
;+ 455,408 306,807 148,601 61.071 36,004 25,066 36,004
2006 472,500 322,545 149,955 62,671 37.466 25,205 37,466
25,345
38,986
38.986
2007
339.091
151.321
64.331
490,412
I 2008 509,238 356`534 152,704 86.058 40,573 25.485 40,573
25,626
42,219
2009'
374,823
42,219
67,846
154.096
528,918
2010 549,550 394,050 155,500 89,701 43,933 25,768 43,933
2011 571,180 414.263 158.917 71.827 45,716 25,911 45,716
I 2012 593,924 435,573 158.351 73.631 47.576 26,055 47.578
49,507
26.199
75,706
49,507
2013
159.794
457.916
617,710
2014 642,656 481,406 161,250 77,860 51,516 26,344 51,516
2015 668,820 506,100 162,719 80,097 53,607 26.490 53,607
I 2016 696,341 532,135 164,206 84,837 55,78S 26,637 55,788
82,425
26,785
58,052
58,052'
185.702
725.134
2017
559,431 `
2018 755,341 588,128 167.212 87.341 60,408 26,933 60,408
2019 787,033 618,297 168,736 89,942 62,860 27,082 62,860
I 2020 820,381 650.'103 170.278 92,650 65,418 27.232 65,418
68,073
27,383
68,073
95.456
171.830
855,280
683,451
2021
2022 891 .905 718.509 173.395 98,370 70,835 27,535 70.835
2023 930,342 755.387 174.975 101.397 73,710 27,687 73,710
I 2024 1 `013,147 794,223 178,574 104,551 76,710 27.841 76,710
9rfo.Jgit
79,823
27,995
79,823
107,818
178,183
834.964
2025
2026 1,057,602 grJT .I 95 179.807 111.213 83,062 28,150 83,062
2027 1,104,268 922,823 181.445 114.740 86,433 28,306 86,433
970,293
28.463
I 2028 1,153.397 1,020,066 183,103 118,414 89,951 28,621 . 93,601
89.951
122,222
93,601
1,204,838
2029
184.772
97,400
28,779
97,400
186,456
126,179
2030
1,258,848
1,072,392
I
I.
/+